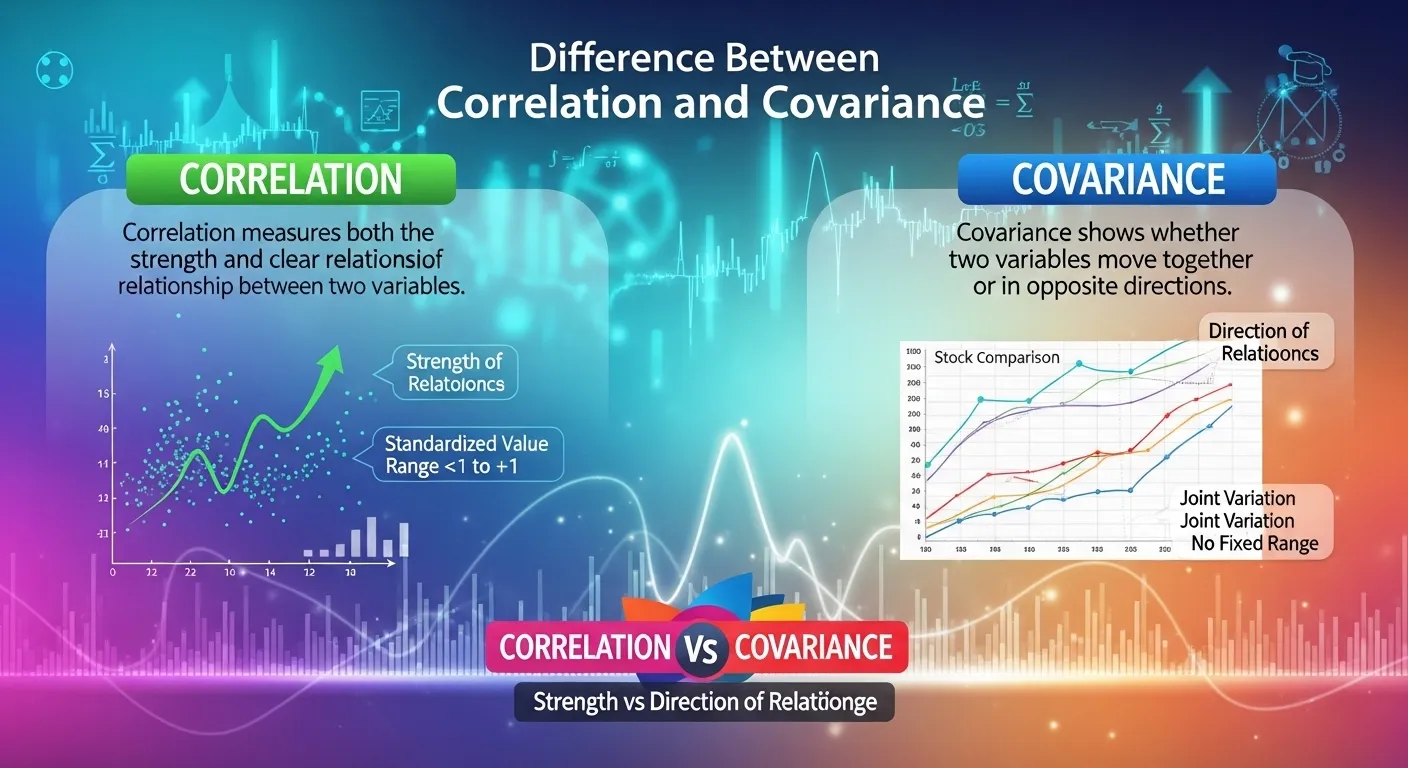
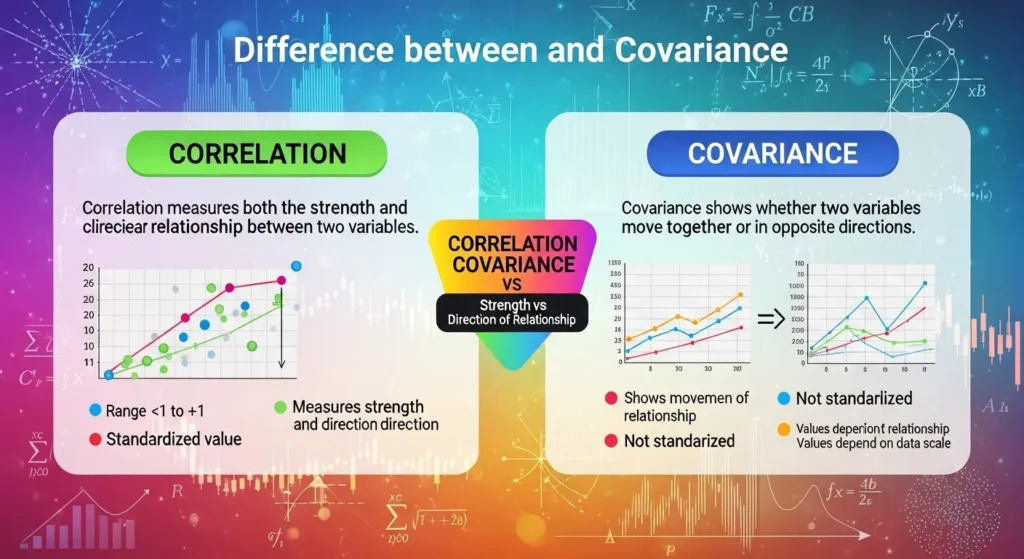
Correlation measures the strength and direction of a linear relationship between two variables, while covariance only indicates the direction of their relationship without standardizing the scale.
In statistics and data analysis, people often hear the terms correlation and covariance. These two concepts are closely related.
However, there is an important difference between correlation or covariance. Many students confuse them because both measure the relationship between two variables.
Imagine a teacher analyzing student data. If study hours increase and exam scores also increase, the variables move together.
Statistics uses tools like covariance and correlation to measure this relationship. This is where understanding the difference between correlation vs covariance becomes useful.
Covariance shows the direction of the relationship between variables. Correlation goes further. It shows both the direction and the strength of that relationship.
Learning the difference between covariance and correlationhelps students in statistics, economics, finance, and data science.
When you understand the difference between correlation and covariance, interpreting data becomes much easier and clearer.
📖 Definitions
📌 Definition of Correlation
Correlation measures the strength and direction of the relationship between two variables.
Its value always ranges between -1 and +1.
If correlation is positive, both variables move in the same direction.
If correlation is negative, they move in opposite directions.
Example:
If study time increases and exam scores increase, the correlation is positive.
📌 Definition of Covariance
Covariance measures the direction of the relationship between two variables.
It shows If variables move together or in opposite directions.
Unlike correlation, covariance does not show the strength clearly.
Example:
If stock A rises when stock B rises, the covariance between them is positive.
🔍 Difference Between Correlation and Covariance
1️⃣ Scope
Correlation:
Correlation measures both direction and strength of the relationship.
It provides a standardized value.
Covariance:
Covariance measures only the direction of the relationship.
It does not standardize the strength.
Examples
Correlation examples:
• Correlation between rainfall and crop yield.
• Correlation between study hours and grades.
Covariance examples:
• Covariance between two stock prices.
• Covariance between temperature and electricity usage.
2️⃣ Purpose
Correlation:
Used to measure how strongly two variables are related.
Covariance:
Used to check If variables move together or opposite.
Examples
Correlation example:
A researcher checks correlation between exercise and health.
Covariance example:
An investor checks covariance between two stocks.
3️⃣ Measurement Scale
Correlation:
Correlation values range from -1 to +1.
Covariance:
Covariance values have no fixed range.
They depend on the data scale.
Examples
Correlation example:
Correlation of 0.8 shows strong positive relation.
Covariance example:
Covariance may be 120, -45, or 300, depending on data.
4️⃣ Units
Correlation:
Correlation has no units.
It is a pure number.
Covariance:
Covariance has units based on the variables.
Examples
Correlation example:
Correlation between height and weight has no units.
Covariance example:
Covariance between height and weight uses measurement units.
5️⃣ Interpretation
Correlation:
Easy to interpret.
Values clearly show relationship strength.
Covariance:
Harder to interpret.
Magnitude depends on variable scale.
Examples
Correlation example:
Correlation of -0.9 means strong negative relationship.
Covariance example:
Covariance value alone may not show strength clearly.
6️⃣ Standardization
Correlation:
Correlation is standardized.
Covariance:
Covariance is not standardized.
Examples
Correlation example:
Correlation allows comparison across datasets.
Covariance example:
Covariance values change with scale.
7️⃣ Use in Data Analysis
Correlation:
Common in statistics and research.
Covariance:
Often used in probability theory and finance.
Examples
Correlation example:
Psychologists study correlation between stress and sleep.
Covariance example:
Finance experts study covariance between investments.
8️⃣ Mathematical Relationship
Correlation:
Correlation is derived from covariance.
Covariance:
Covariance is the base calculation.
Examples
Correlation example:
Correlation = Covariance / (standard deviations).
Covariance example:
Covariance formula measures joint variation.
9️⃣ Applications
Correlation:
Used in data science and machine learning.
Covariance:
Used in portfolio theory and statistics.
Examples
Correlation example:
Data scientists analyze correlations in datasets.
Covariance example:
Investors calculate covariance between assets.
🔟 Key Difference Summary
The main difference between correlation and covariance lies in how they measure relationships.
Covariance shows the direction of the relationship between variables.
Correlation shows both the direction and strength of that relationship.
Correlation is standardized between -1 and +1, while covariance has no fixed range. Understanding the difference between correlation and covariance helps researchers interpret data more accurately.
🏁 Conclusion
The difference between correlation and covariance is mainly about interpretation and measurement.
Both statistical tools measure the relationship between two variables. However, they present the information in different ways.
Covariance focuses on the direction of the relationship. It shows If two variables move together or in opposite directions.
If covariance is positive, the variables increase together. If it is negative, one increases while the other decreases.
However, covariance values depend on the scale of the data. This makes them harder to interpret directly.
Correlation improves this measurement. It standardizes the relationship between -1 and +1. This makes correlation easier to understand. A value close to +1 means a strong positive relationship.
A value close to -1 means a strong negative relationship. The value near 0 means little or no relationship.
Understanding the difference between correlation and covariance is essential for students, analysts, and researchers. These concepts are widely used in statistics, economics, finance, and data science.
When used correctly, they help people analyze patterns, identify trends, and make better decisions based on data.
Discover More Articals!
🥞 Difference Between Crepes and Pancakes: Simple Guide
📘 Difference Between Are and Our: Clear and Simple Guide

labdiff.com is my English grammar comparison website where I simplify confusing words, spelling differences, and usage rules through clear explanations and examples. My goal is to help learners, writers, and students understand English easily and use correct grammar with confidence.